Impossible Measurements
Scott Prahl
Dec 2021
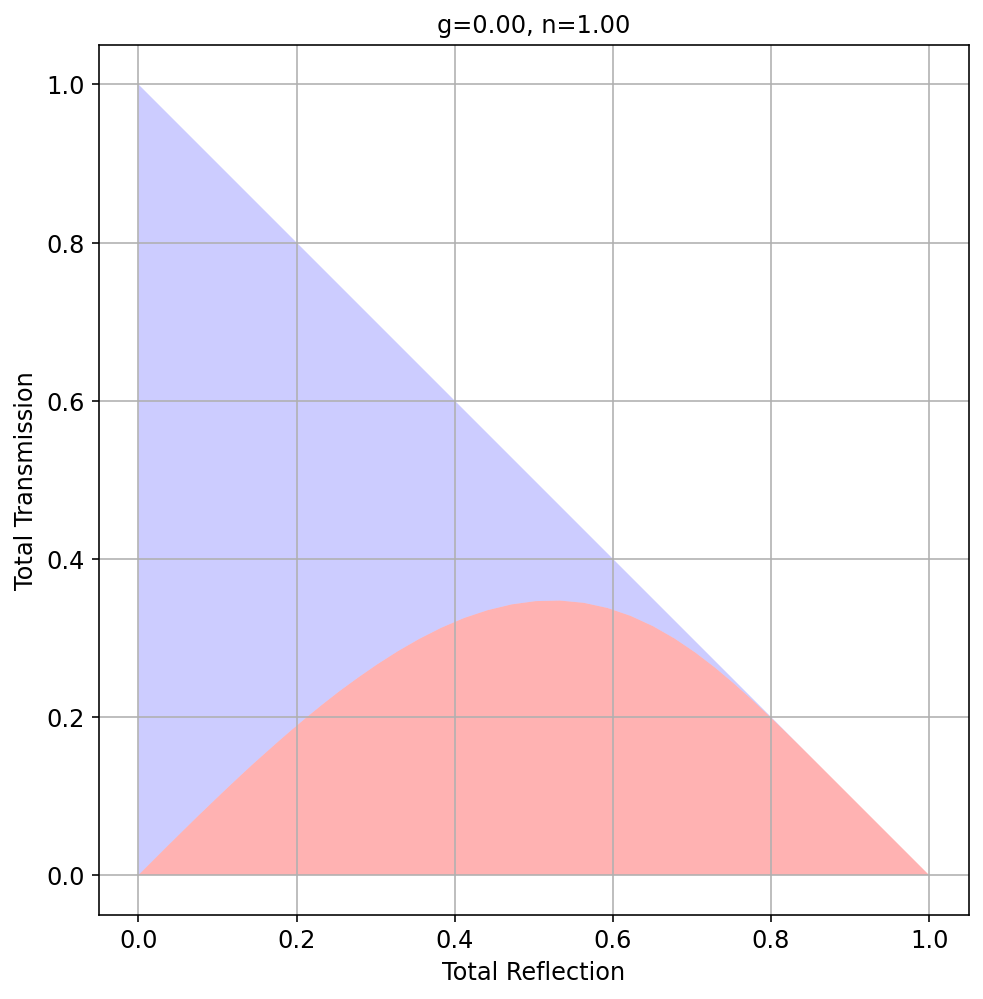
With ideal measurements of total reflection and total transmission, there are unique values for the albedo and optical thickness.
Of course, in practice measurements are not perfect.
[1]:
import numpy as np
import matplotlib.pyplot as plt
import iadpython as iad
%config InlineBackend.figure_format = 'retina'

def scattered_light(g=0, n=1, quad_pts=4):
    """Max scattered light for all optical thicknesses."""
    b = np.logspace(-5,5,200)
    r_white, t_white, _, _ = iad.Sample(a=1, b=b, g=g, n=n, quad_pts=quad_pts).rt()
    r_black, t_black, _, _ = iad.Sample(a=0, b=b, g=g, n=n, quad_pts=quad_pts).rt()

    xy = np.array([r_white-r_black, t_white-t_black]).T
    return xy

def unscattered_polygon(g=0, n=1, quad_pts=4):
    """Unscattered light for all optical thicknesses."""
    xy = scattered_light(g, n, quad_pts)
    xy = np.append(xy, np.array([[1,0]]), axis=0)
    xy = np.append(xy, np.array([[0,1]]), axis=0)
    xy = np.append(xy, np.array([[0,0]]), axis=0)

    return plt.Polygon(xy, facecolor='b', alpha=0.2)

def scattered_polygon(g=0,n=1,quad_pts=4):
    xy = scattered_light(g, n, quad_pts)
    xy = np.append(xy, np.array([[0,0]]), axis=0)

    return plt.Polygon(xy, facecolor='r', alpha=0.3)
Index matched case
[2]:
n=1.0
g=0.0


plt.figure(figsize=(8,8))


plt.gca().add_patch(scattered_polygon(g,n))
plt.gca().add_patch(unscattered_polygon(g,n))

plt.gca().set_aspect(1)
plt.xlim(-0.05,1.05)
plt.ylim(-0.05,1.05)

plt.title("g=%.2f, n=%.2f" % (g,n))
plt.xlabel('Total Reflection',fontsize=12)
plt.ylabel('Total Transmission',fontsize=12)
plt.xticks(fontsize=12)
plt.grid()

plt.yticks(fontsize=12)

plt.show()
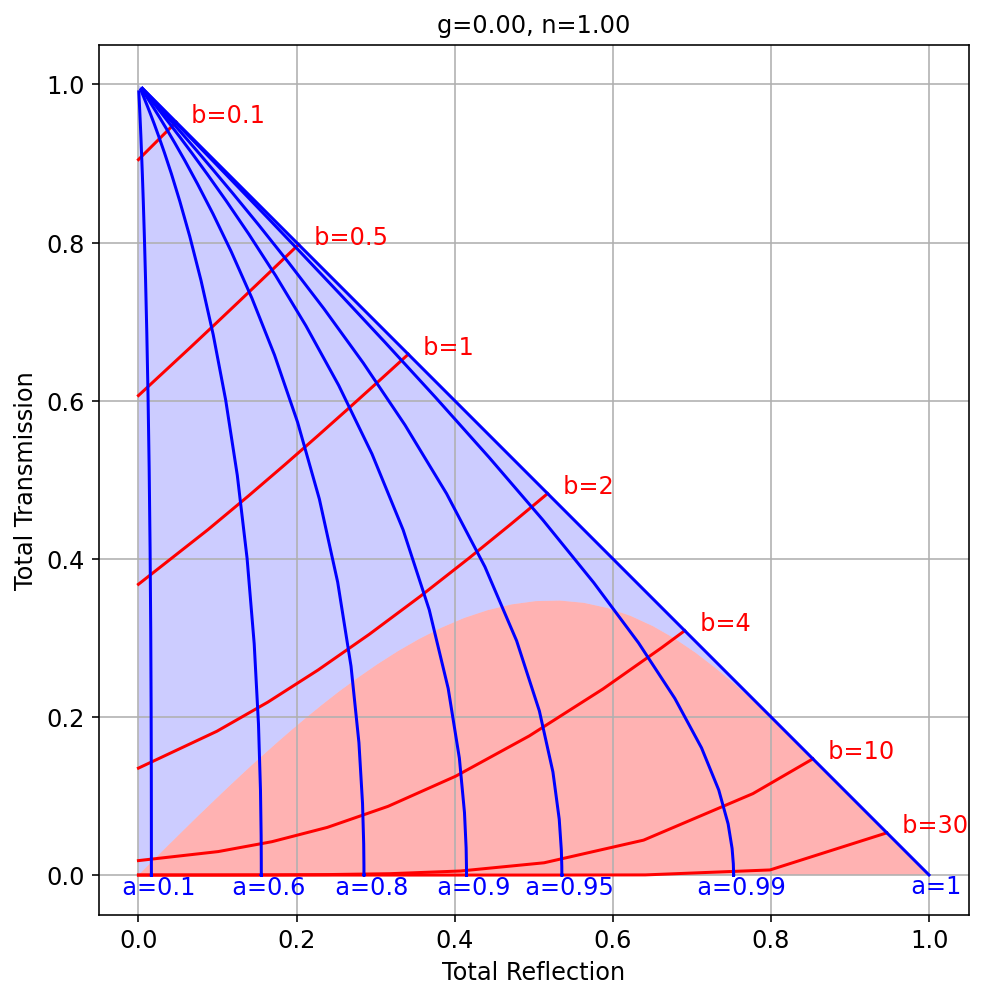
[3]:
n=1.0
g=0.0


plt.figure(figsize=(8,8))

s = iad.Sample(g=g, n=n)
s.a = np.sqrt(1-np.linspace(1,0,10)**2)

for b in [ 0.1,  1, 0.5, 2, 4, 10, 30]:
    s.b = b
    UR1, UT1, _, _ = s.rt()

    plt.plot(UR1, UT1,'r', markersize=2)
    plt.text(UR1[-1], UT1[-1],"  b=%g"%s.b,fontsize=12,color='red')

s.b = np.logspace(-2,4,50)
for a in [0.1, 0.6, 0.8, 0.9, 0.95, 0.99,1]:
    s.a = a
    UR1, UT1, _, _ = s.rt()
    plt.plot(UR1, UT1,'b', markersize=2)
    plt.text(UR1[-1], UT1[-1],"  a=%g"%s.a,fontsize=12,ha='center',va='top',color='blue')


plt.gca().add_patch(scattered_polygon(g,n))
plt.gca().add_patch(unscattered_polygon(g,n))

plt.gca().set_aspect(1)
plt.xlim(-0.05,1.05)
plt.ylim(-0.05,1.05)

plt.title("g=%.2f, n=%.2f" % (g,n))
plt.xlabel('Total Reflection',fontsize=12)
plt.ylabel('Total Transmission',fontsize=12)
plt.xticks(fontsize=12)
plt.grid()

plt.yticks(fontsize=12)

plt.show()
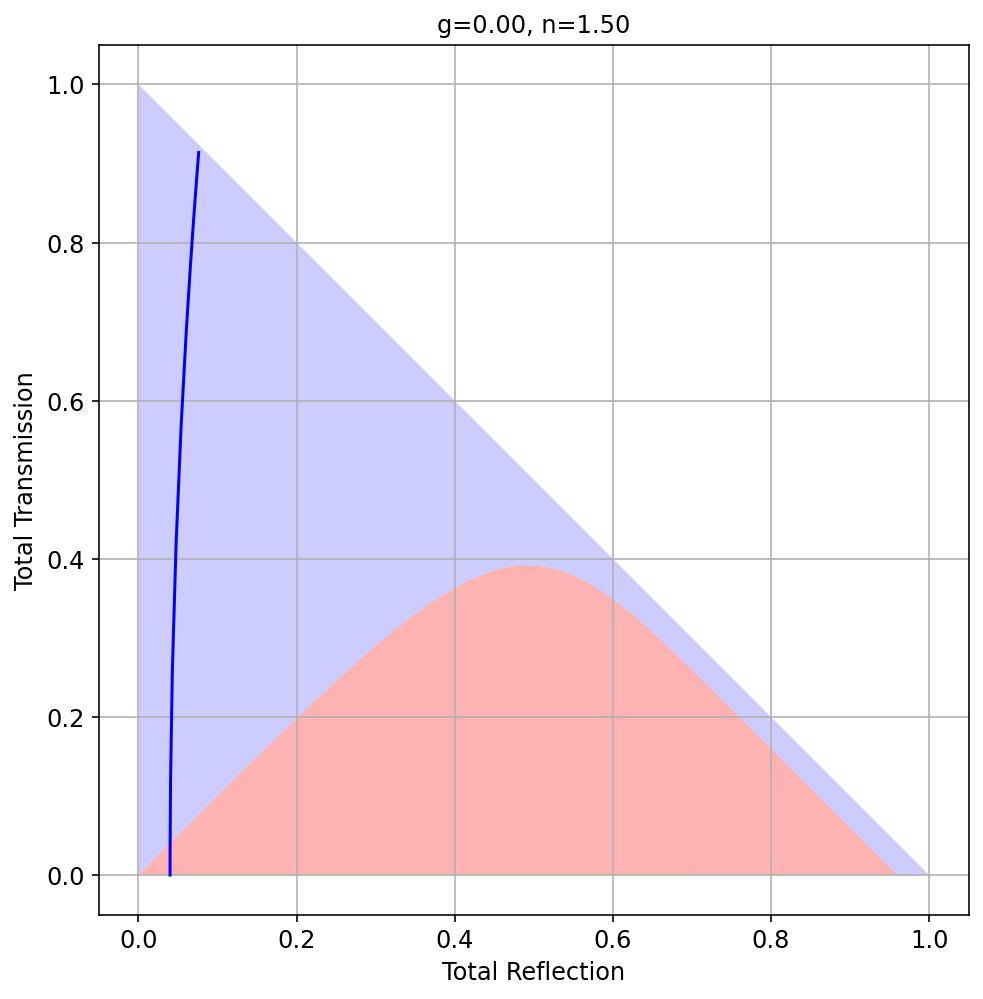
[4]:
n=1.5
g=0.0


plt.figure(figsize=(8,8))

s = iad.Sample(g=g, n=n)

s.b = np.logspace(-2,2,20)
UR1 = np.zeros_like(s.b)
UT1 = np.zeros_like(s.b)
for i,b in enumerate(np.logspace(-2,2,20)):
    s.b = b
    UR1[i], UT1[i] = s.unscattered_rt()

plt.plot(UR1, UT1,'b', markersize=2)
#plt.text(UR1[-1], UT1[-1],"  a=%g"%a,fontsize=12,ha='center',va='top')


plt.gca().add_patch(scattered_polygon(g,n))
plt.gca().add_patch(unscattered_polygon(g,n))

plt.gca().set_aspect(1)
plt.xlim(-0.05,1.05)
plt.ylim(-0.05,1.05)

plt.title("g=%.2f, n=%.2f" % (g,n))
plt.xlabel('Total Reflection',fontsize=12)
plt.ylabel('Total Transmission',fontsize=12)
plt.xticks(fontsize=12)
plt.grid()

plt.yticks(fontsize=12)

plt.show()
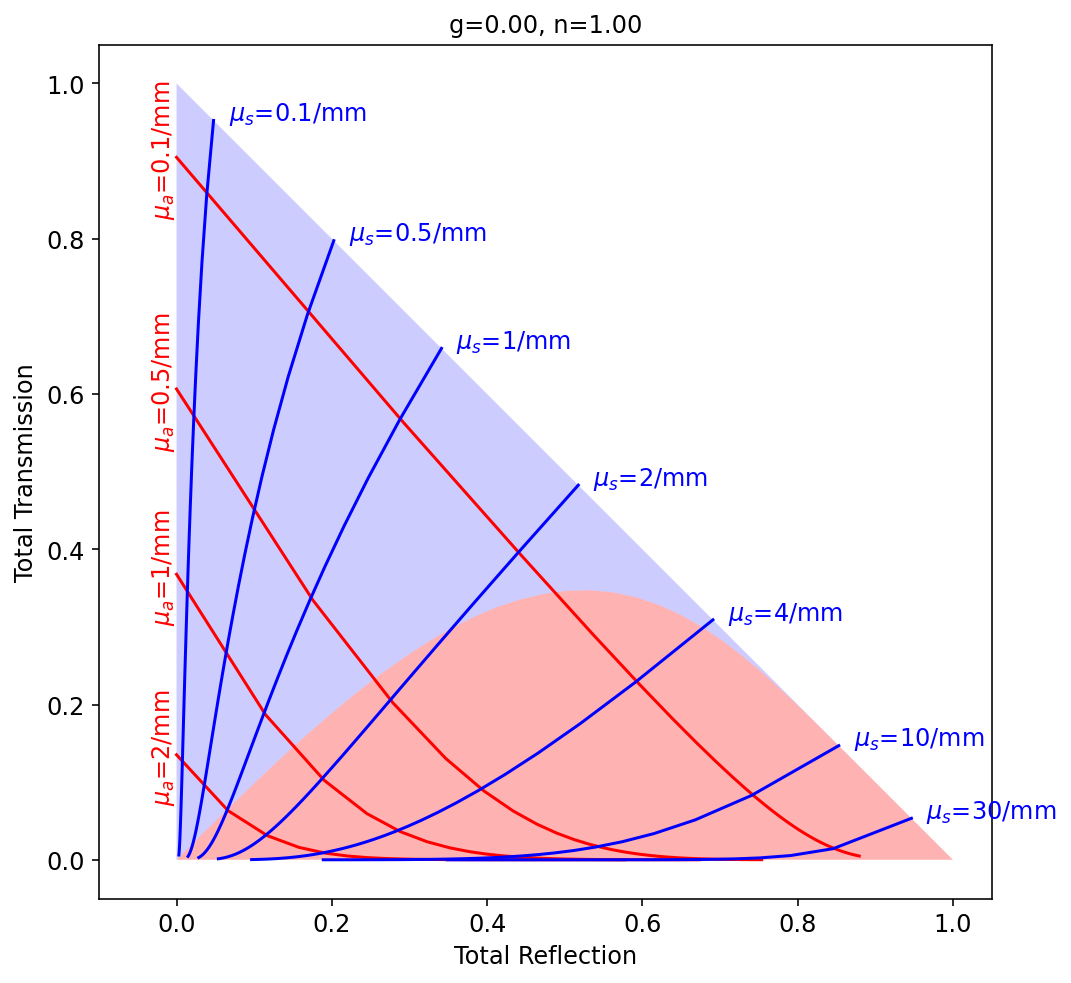
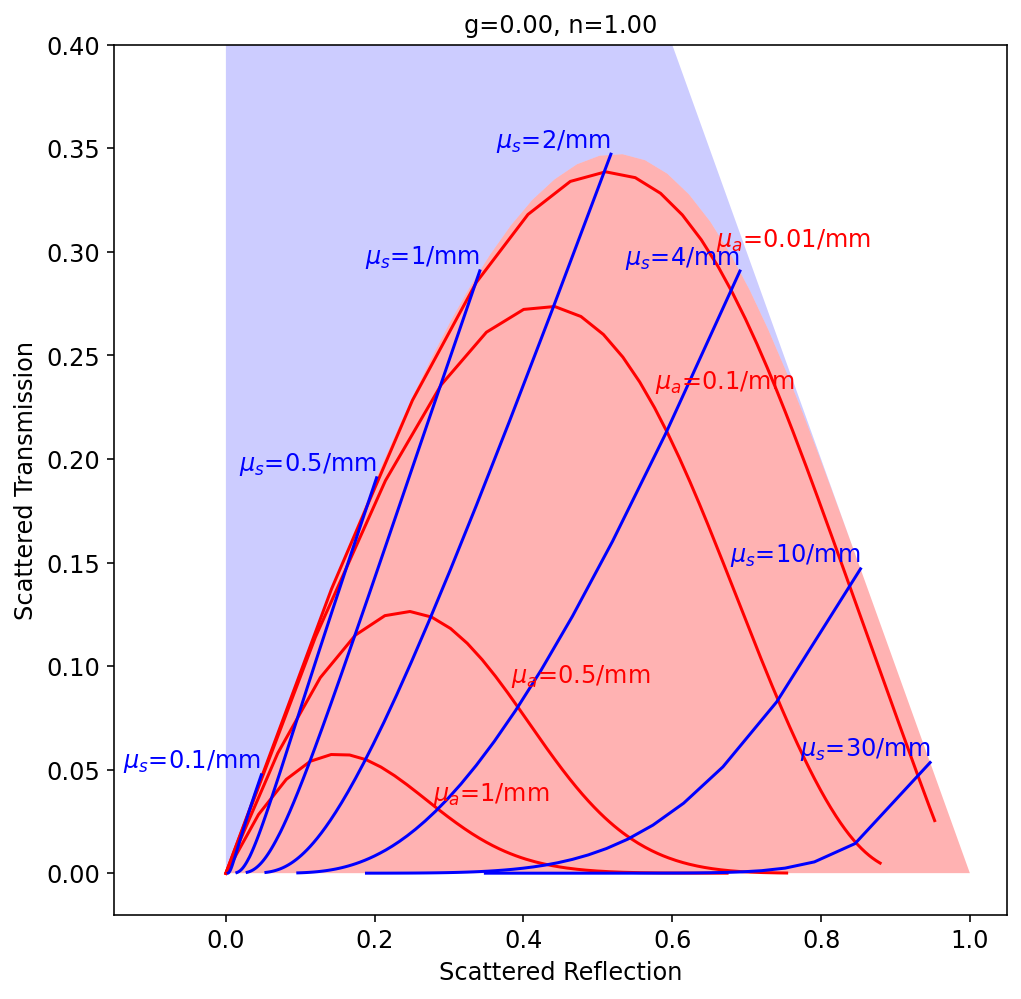
[5]:
n=1.0
g=0.0
d = 1

plt.figure(figsize=(8,8))

s = iad.Sample(a=a, g=g, n=n)
mus = np.linspace(0,50)

for mua in [ 0.1,  1, 0.5, 2]:
    s.a = mus/(mus+mua)
    s.b = (mus+mua)*d
    UR1, UT1, _, _ = s.rt()

    plt.plot(UR1, UT1,'r', markersize=2)
    plt.text(UR1[0], UT1[0],"  $\mu_a$=%g/mm"%mua,fontsize=12,ha='right',va='center',rotation='vertical',color='red')


mua = np.linspace(0,5)

for mus in [ 0.1,  1, 0.5, 2, 4, 10, 30]:

    s.a = mus/(mus+mua)
    s.b = (mus+mua)*d

    UR1, UT1, _, _ = s.rt()
    plt.plot(UR1, UT1,'b', markersize=2)
    plt.text(UR1[0], UT1[0],"  $\mu_s$=%g/mm"%mus,fontsize=12, color='blue')


plt.gca().add_patch(scattered_polygon(g,n))
plt.gca().add_patch(unscattered_polygon(g,n))

plt.gca().set_aspect(1)
plt.xlim(-0.1,1.05)
plt.ylim(-0.05,1.05)

plt.title("g=%.2f, n=%.2f" % (g,n))
plt.xlabel('Total Reflection',fontsize=12)
plt.ylabel('Total Transmission',fontsize=12)
plt.xticks(fontsize=12)

plt.yticks(fontsize=12)

plt.show()
[58]:
n=1.0
g=0.0
d = 1

plt.figure(figsize=(8,8))

s = iad.Sample(a=a, g=g, n=n)
mus = np.linspace(0,50,150)

for mua in [0.01, 0.1, 0.5, 1]:
    s.a = mus/(mus+mua)
    s.b = (mus+mua)*d
    UR1, UT1, _, _ = s.rt()
    rc,tc = s.unscattered_rt()
    UR1 -= rc
    UT1 -= tc

    plt.plot(UR1, UT1,'r', markersize=2)
    plt.text(UR1[10], UT1[10],"  $\mu_a$=%g/mm"%mua,fontsize=12,ha='left',va='center',color='red')


mua = np.linspace(0,5)

for mus in [ 0.1,  1, 0.5, 2, 4, 10, 30]:

    s.a = mus/(mus+mua)
    s.b = (mus+mua)*d

    UR1, UT1, _, _ = s.rt()
    rc,tc = s.unscattered_rt()
    UR1 -= rc
    UT1 -= tc
    plt.plot(UR1, UT1,'b', markersize=2)
    plt.text(UR1[0], UT1[0],"  $\mu_s$=%g/mm"%mus,fontsize=12, color='blue', ha='right', va='bottom')


plt.gca().add_patch(scattered_polygon(g,n))
plt.gca().add_patch(unscattered_polygon(g,n))

#plt.gca().set_aspect(1)
plt.xlim(-0.15,1.05)
plt.ylim(-0.02 ,0.4)

plt.title("g=%.2f, n=%.2f" % (g,n))
plt.xlabel('Scattered Reflection',fontsize=12)
plt.ylabel('Scattered Transmission',fontsize=12)
plt.xticks(fontsize=12)
plt.yticks(fontsize=12)

plt.show()
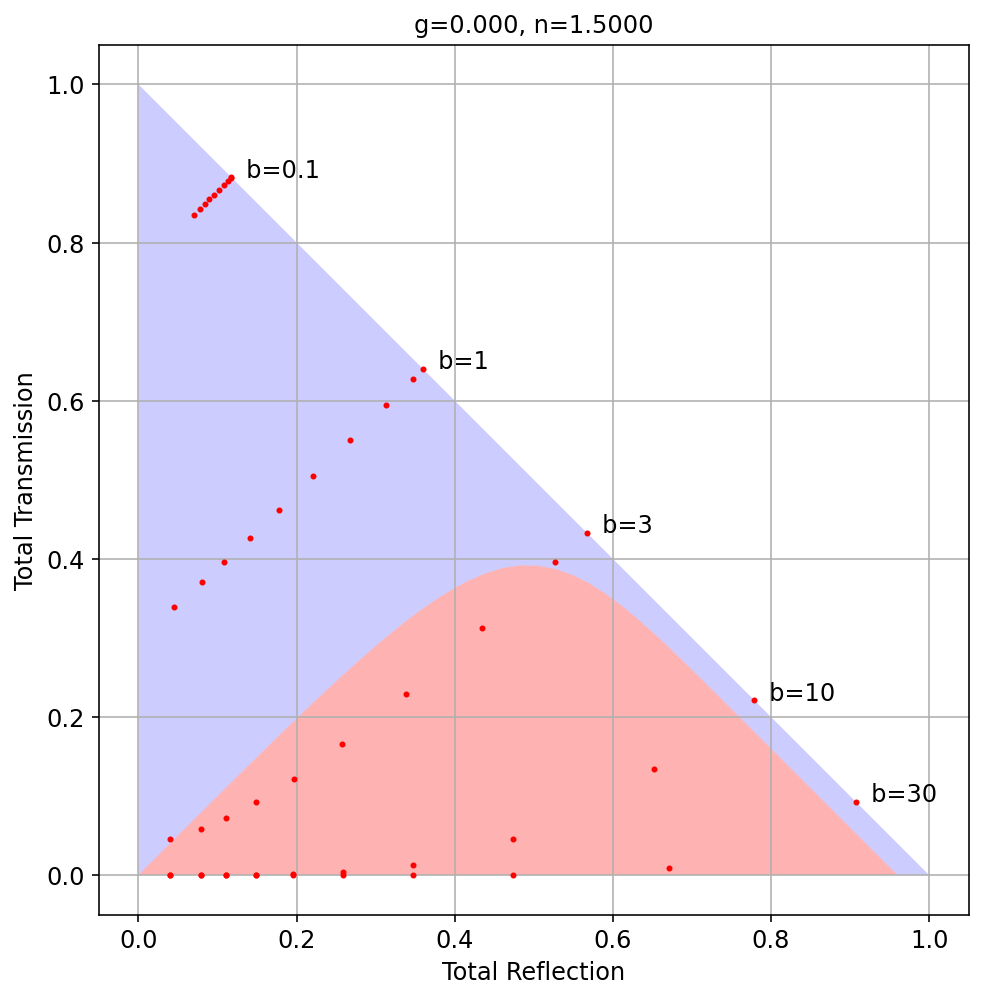
[51]:
n=1.5
g=0.0

a = np.sqrt(1-np.linspace(1,0,10)**2)

plt.figure(figsize=(8,8))
for i,b in enumerate([ 0.1,  1, 3, 10, 30]):
    s = iad.Sample(a,b,n=n)
    UR1, UT1, _, _ = s.rt()

    plt.plot(UR1,UT1,'or', markersize=2)
    plt.text(UR1[-1],UT1[-1],"  b=%g"%b,fontsize=12)


plt.gca().add_patch(scattered_polygon(g,n))
plt.gca().add_patch(unscattered_polygon(g,n))

plt.gca().set_aspect(1)
plt.xlim(-0.05,1.05)
plt.ylim(-0.05,1.05)

plt.title("g=%.3f, n=%.4f" % (g,n))

plt.xlabel('Total Reflection',fontsize=12)
plt.ylabel('Total Transmission',fontsize=12)
plt.xticks(fontsize=12)
plt.grid()

plt.yticks(fontsize=12)

plt.show()
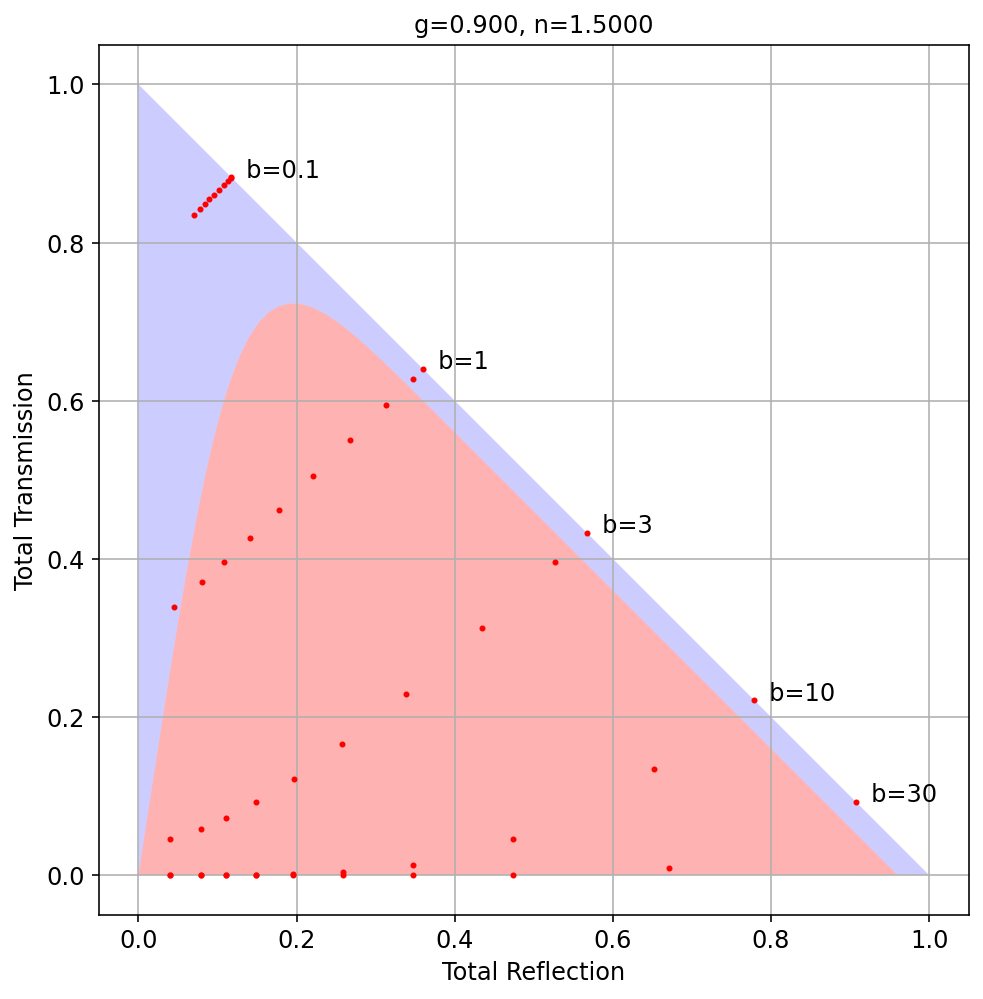
[8]:
n=1.5
g=0.9

a = np.sqrt(1-np.linspace(1,0,10)**2)

plt.figure(figsize=(8,8))
for i,b in enumerate([ 0.1,  1, 3, 10, 30]):
    s = iad.Sample(a,b,n=n)
    UR1, UT1, _, _ = s.rt()

    plt.plot(UR1,UT1,'or', markersize=2)
    plt.text(UR1[-1],UT1[-1],"  b=%g"%b,fontsize=12)


plt.gca().add_patch(scattered_polygon(g,n))
plt.gca().add_patch(unscattered_polygon(g,n))

plt.gca().set_aspect(1)
plt.xlim(-0.05,1.05)
plt.ylim(-0.05,1.05)

plt.title("g=%.3f, n=%.4f" % (g,n))


plt.xlabel('Total Reflection',fontsize=12)
plt.ylabel('Total Transmission',fontsize=12)
plt.xticks(fontsize=12)
plt.grid()

plt.yticks(fontsize=12)

plt.show()
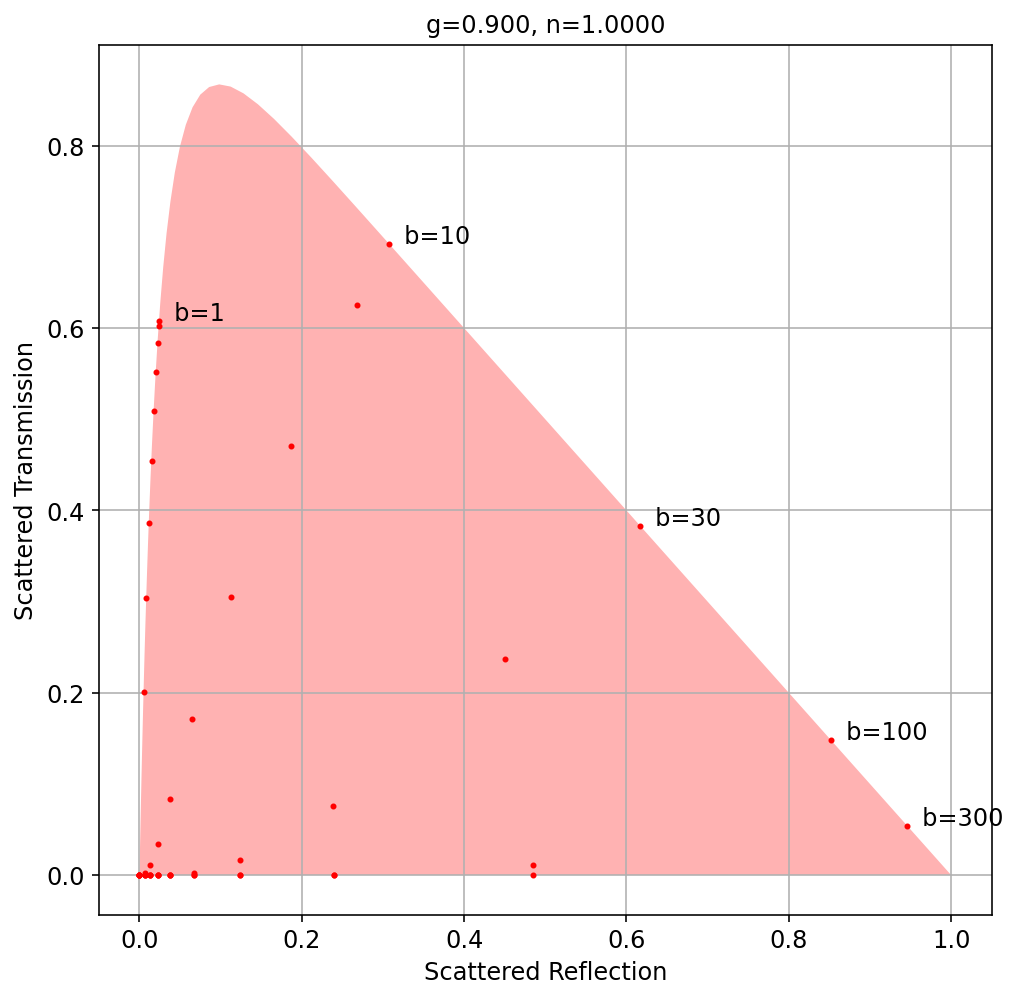
[9]:
n=1.0
g=0.9

a = np.sqrt(1-np.linspace(1,0,10)**2)

plt.figure(figsize=(8,8))
bb = np.array([ 0.1,  1, 3, 10, 30])/(1-g)

for i,b in enumerate(bb):
    bprime = b*(1-g*a)
    aprime = a*(1-g)/(1-a*g)
    s = iad.Sample(a,b,n=n,g=g)
    UR1, UT1, _, _ = s.rt()
    UR1 -= UR1[0]
    UT1 -= UT1[0]
    plt.plot(UR1,UT1,'or', markersize=2)
    plt.text(UR1[-1],UT1[-1],"  b=%g"%b,fontsize=12)


plt.gca().add_patch(scattered_polygon(g,n))

plt.xlim(-0.05,1.05)
#plt.ylim(-0.05,1.05)
plt.title("g=%.3f, n=%.4f" % (g,n))


plt.xlabel('Scattered Reflection',fontsize=12)
plt.ylabel('Scattered Transmission',fontsize=12)
plt.xticks(fontsize=12)
plt.grid()

plt.yticks(fontsize=12)

plt.show()
[10]:
n=1.5
b_list=np.logspace(-4,2)
g=0.9
ru=np.zeros_like(b_list)
tu=np.zeros_like(b_list)
for i,b in enumerate(b_list):
    ru[i], tu[i] = iad.fresnel.specular_rt(1, n, 1, b, 1)

RU, TU, _, _ = iad.Sample(0,b_list,n=n,g=0.9,quad_pts=32).rt()

plt.semilogx(b_list,-RU+ru)
plt.semilogx(b_list,-TU+tu)
plt.show()
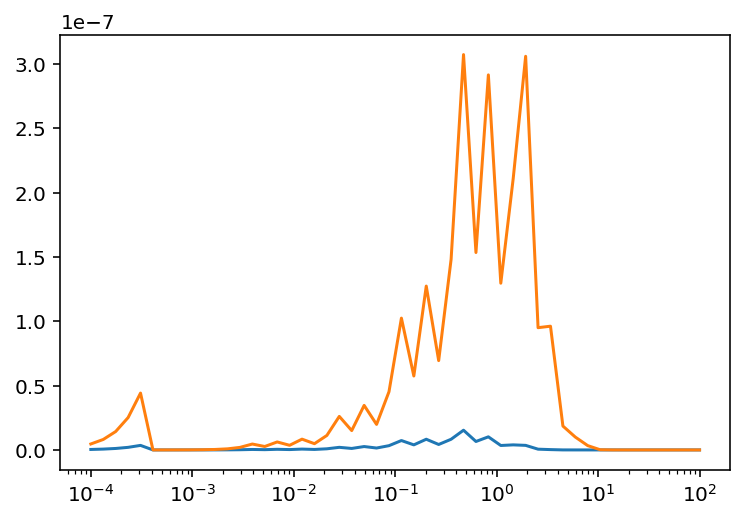
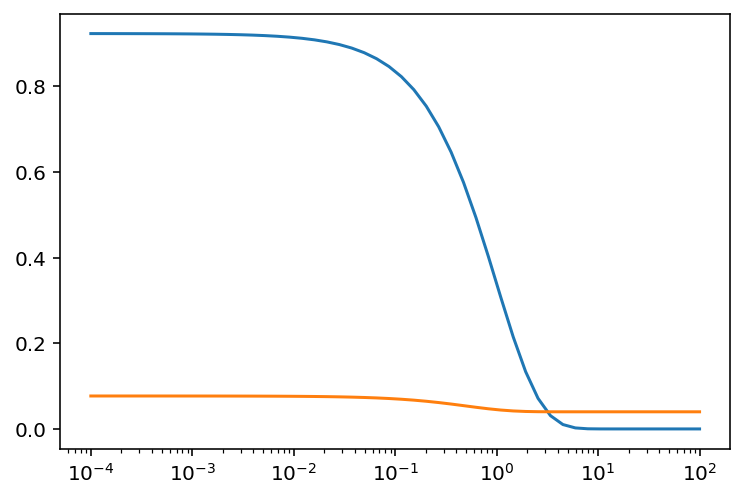
[11]:
n=1.5
b_list=np.logspace(-4,2)
g=0.9
ru=np.zeros_like(b_list)
tu=np.zeros_like(b_list)
for i,b in enumerate(b_list):
    ru[i], tu[i] = iad.fresnel.absorbing_glass_RT(1.0, 1.5, 1.0, 1, b)

RU, TU, _, _ = iad.Sample(0,b_list,n=n,g=0.9,quad_pts=32).rt()

plt.semilogx(b_list,TU)
plt.semilogx(b_list,RU)
plt.show()
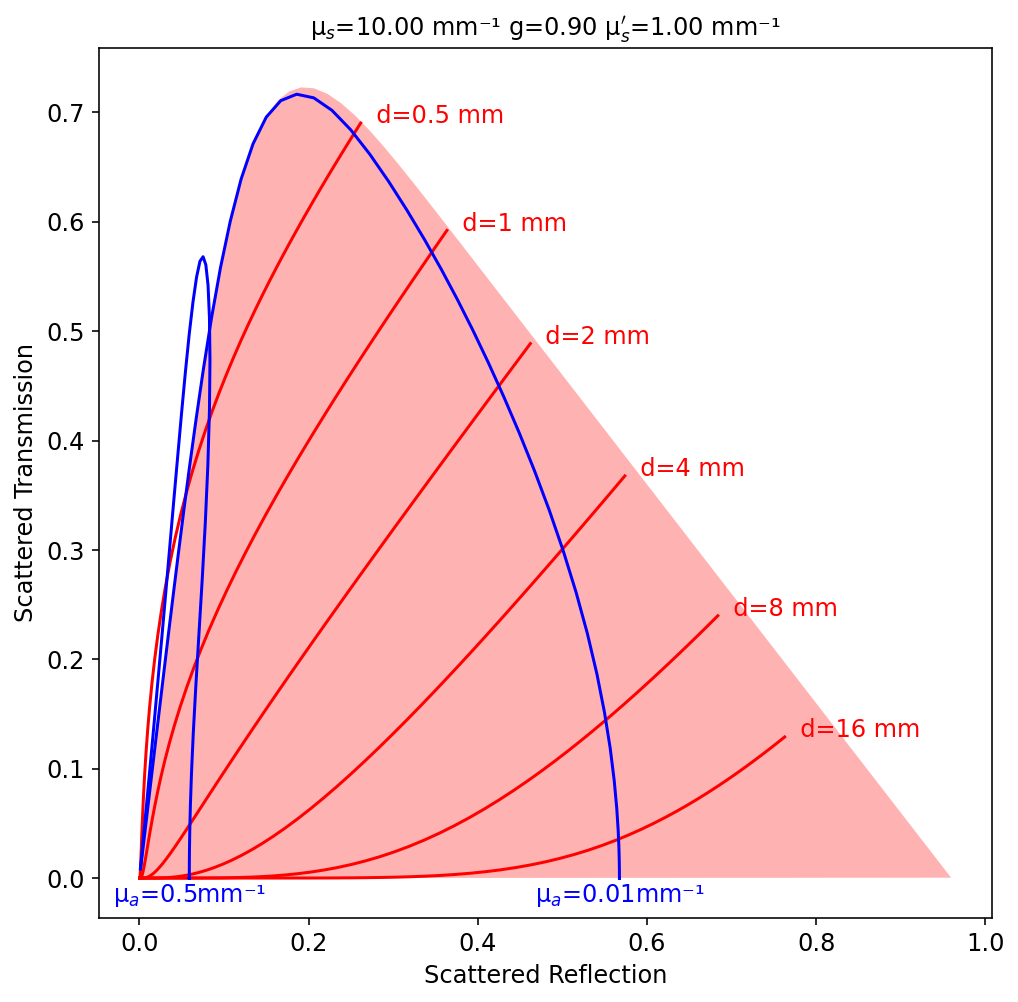
[12]:
n=1.5
g=0.9
N=4
mu_s = 1/(1-g)
plt.figure(figsize=(8,8))

#draw lines of constant sample thickness
mu_a = np.logspace(-3,2,100)
dd = np.array([0.5, 1, 2, 4, 8, 16])

for i,d in enumerate(dd):
    a = mu_s/(mu_s+mu_a)
    b = (mu_s+mu_a)*d
    s = iad.Sample(a,b,n=n,g=g,quad_pts=N)
    UR1, UT1, _, _ = s.rt()

    s = iad.Sample(0,b,n=n,g=g,quad_pts=N)
    UR0, UT0, _, _ = s.rt()
    UR1 -= UR0
    UT1 -= UT0

    plt.plot(UR1,UT1,'r')

    for j in range(len(mu_a)):
        if False and UR1[j]<0.1:
            bprime = a[j]*b[j]*(1-g)+(1-a[j])*b[j]
            plt.text(UR1[j],UT1[j],"%.2f,%.2f"%(a[j],b[j]),color='blue')


    if d<=2*(1-g):
        plt.text(UR1[0],UT1[0],"  d=%g mm"%d,fontsize=12,ha='right',color='red')
    else:
        plt.text(UR1[0],UT1[0],"  d=%g mm"%d,fontsize=12,color='red')

# draw lines of constant mu_a
mua_list = np.array([0.01, 0.5])
d = np.logspace(-3, 4, 100)

for i,mu_a in enumerate(mua_list):
    a = mu_s/(mu_s+mu_a)
    b = (mu_s+mu_a)*d

    UR1, UT1, _, _ = iad.Sample(a,b,n=n,g=g,quad_pts=N).rt()
    UR0, UT0, _, _ = iad.Sample(0,b,n=n,g=g,quad_pts=N).rt()
    UR1 -= UR0
    UT1 -= UT0

    plt.plot(UR1,UT1,'b')
    for j in range(len(d)):
        if False and UR1[j]<0.1:
            bprime = a*b[j]*(1-g)+(1-a)*b[j]
            plt.text(UR1[j],UT1[j],"%.2f,%.2f"%(a,b[j]),color='blue')

    plt.text(UR1[-1],-0.003,"µ$_a$=%gmm⁻¹"%mu_a,fontsize=12,ha='center',va='top',color='blue')

plt.title("µ$_s$=%.2f mm⁻¹ g=%.2f µ$_s'$=%.2f mm⁻¹"%(mu_s,g,mu_s*(1-g)))
plt.gca().add_patch(scattered_polygon(g,n,quad_pts=N))

#plt.xlim(0,0.1)
#plt.ylim(-0.05,0.25)

plt.xlabel('Scattered Reflection',fontsize=12)
plt.ylabel('Scattered Transmission',fontsize=12)
plt.xticks(fontsize=12)
#plt.grid()

plt.yticks(fontsize=12)

plt.show()
[ ]:
[ ]: